The data tells a story nobody expected
We studied 467 corporate leaders, scoring each one across 32 distinct motivational dynamics, and what emerged wasn’t what the leadership books told us to expect.
It wasn’t charisma, a commanding presence, or the corner-office swagger that Hollywood loves to cast. What actually drives corporate leaders is quieter, more paradoxical, and far more interesting than the mythology we’ve built around leadership. And if you’re a leader reading this, there’s a very good chance the data is about to describe something you’ve felt your whole career but never had the language for.
Here’s what we found.
The leadership signature: Five Motivations that define corporate leaders
Out of 32 possible motivational dynamics, five rose decisively above the rest. Not by a little, by a lot — and with remarkably low variance, meaning this isn’t a pattern driven by outliers. It’s nearly universal.
These are the five Motivations that define the corporate leadership population:
When we set the bar at a score of 7 or above, a solid indicator that a Motivation is genuinely active in someone’s life, more than 82% of all leaders clear it on every single one of these five dynamics. That’s not a trend. That’s a shared foundation.
Let’s unpack what this actually means…
Finish: The number one Motivation nobody predicted
If you had to guess the single strongest Motivation across nearly 500 corporate leaders, what would you pick? Ambition? Influence? The desire to win? It’s none of those. Finish — the Motivation to look at a completed product and know you’ve accomplished what you set out to do — ranks number one.
The numbers are striking.
- Seven out of ten leaders score 8 or above on Finish.
- Nearly half — 47% — score 9 or above.
- Only 4% of leaders score below a 5.
It is, statistically, the single most consistent Motivation in the corporate leadership population, and it shows up as the single highest Motivation, in the number one slot, for 49 leaders, more than any other dynamic. When it’s number one, the motivations that cluster around it tell a story of their own: Also appearing in the top five Motivations are:
- Meet The Challenge — 37% of the time
- Realize The Vision — 33%
- Overcome — 27%
- Develop — 24%
This is a Motivation about closing. Starting things and finishing them. It’s the instinct that keeps a leader focused on outcomes when the middle of a project gets messy, when the team loses momentum, and when easier paths appear. Leaders with high Finish rankings don’t just have goals. They have finish lines. And they are wired to cross them.
What makes this the number-one finding? Because it tells us that the foundation of corporate leadership isn’t vision, strategy, or charisma. It’s completion. The people who rise to lead organizations are, first and foremost, people who get things done.
Meet The Challenge: The engine that won’t quit
Right behind Finish, and deeply connected to it, sits Meet The Challenge. This is the Motivation to experience a sense of achievement by looking back over challenges that have been met. Beyond doing hard things, this Motivation is about having done them.
71% of leaders score Meet The Challenge at 8 or above, and when we look at how this Motivation interacts with Overcome — the Motivation to persevere through difficulties and opposition — we find one of the strongest correlations in the entire dataset (r=0.67). Over half of all leaders, 52.5%, score 8 or above on both.
This is what we call the Grit Circuit.
These two Motivations reinforce each other.
The leader who meets the challenge doesn’t just tolerate difficulty — they metabolize it. Overcome adds a layer of tenacity, the willingness to push through not just hard problems but hard opposition. Together, they create the motivational backbone of leadership: The drive to face hard things, the resilience to endure them, and the deep satisfaction of having prevailed.
It’s worth noting what this pairing is not. It’s not about competition or winning for the sake of winning. This motivational dynamic is retrospective — looking back over what’s been done. These are people who are most alive not in the moment of victory, but in the reflection afterward. That’s an important distinction for anyone trying to motivate leaders: Give them meaningful challenges, then give them space to reflect on what they’ve accomplished.
Realize The Vision: Where ideas become real
The third member of the leadership signature is Realize The Vision, the Motivation to take a concept and make it a reality. Two-thirds of leaders score this Motivation at 8 or above, and unlike the pure “visionary” stereotype, it is emphatically practical. It’s not about dreaming, but about building.
The data makes this distinction clear through correlation. When Realize The Vision is a leader’s number one Motivation, true for 35 leaders in the study, the Motivations that most commonly accompany it are:
- Identify Potential — 40% of the time
- Be Key — 37%
- Make An Impact — 37%
This is a cluster oriented around seeing what could be, then making it happen.
Identify Potential: Correlation across the full population (r=0.51)
These are leaders who don’t just execute on someone else’s vision — they spot the untapped opportunity and then build toward it. In a corporate context, this is the executive who sees the adjacent market, the underutilized asset, the team that could be reorganized into something more powerful — and who is then motivated to bring that possibility into reality.
Make An Impact: The quiet constant
Make An Impact, the Motivation to shape and influence the world around you, holds a unique statistical position. Its average score of 8.26 is high, but what’s more interesting is that it has the lowest variance of any Motivation in the study (std = 1.36). That means leaders consistently score high on it. Over 83% of leaders score Make An Impact at 7 or above.
This is not the same as wanting to be seen.
- Make An Impact and Evoke Recognition, the desire to capture attention and interest, are only modestly correlated. The typical corporate leader wants to change things, not be recognized for changing them. It’s an inside-out Motivation: The drive comes from the work itself, not the spotlight that follows it.
- Make An Impact also pairs consistently with Be Key (r=0.44) and Experience The Ideal (r=0.35), which suggests that for many leaders, the impact they want to make is rooted in something larger than themselves — values, purpose, a vision of how things should work.
Be Key: The hub, not the hero
The fifth element of the leadership signature — Be Key — is perhaps the most misunderstood from the outside. This is the Motivation to be a key person who holds things together and gives meaning or direction to the work. Over 63% of leaders score Be Key at 8 or above.
Be Key is not about ego. It’s about centrality. These are leaders who are motivated by playing a critical role — being the person without whom things wouldn’t cohere. When Be Key is a leader’s top motivation, the companions that emerge are:
- Make An Impact — 32% of the time
- Realize The Vision — 30%
- Meet Needs — 27%
- Evoke Recognition — 27%
That last Motivation is worth pausing on. Be Key and Evoke Recognition do correlate (r=0.41), which means there’s a subpopulation of leaders for whom being central and being recognized for it are intertwined. But for the majority, Be Key operates without that recognition impulse. Most leaders want to be the person who makes it all work — not the person on the magazine cover.
The quiet achiever effect
Here is where the data becomes genuinely surprising. We created two composite scores for each leader:
- One averaging what we call “visible” Motivations: Evoke Recognition, Be Unique, Take Charge, and Persuade.
- One averaging “quiet” motivations: Finish, Meet The Challenge, Meet Needs, and Do It Right.
Then we compared them, and what we discovered is that 81.6% of all corporate leaders lean toward the quiet side. The average gap is 1.28 points — substantial on a scoring scale where most differences are measured in tenths.
This finding cuts against nearly everything popular culture tells us about leadership. The leaders in this study, people running real organizations, are not motivated by commanding a room. They are motivated by:
- Finishing what they started
- Meeting the challenge in front of them
- Serving the needs around them
- Doing it right
That doesn’t mean they’re invisible. Many of them are highly effective public communicators. But the Motivation — the thing that gets them up in the morning — is about the work, not the performance of the work. For organizations trying to identify future leaders, this has enormous implications. If you’re looking for the loudest voice in the room, you’re likely passing over the person who is most motivated to actually lead.
Meet Needs: The island Motivation
The finding that stopped us in our tracks is that Meet Needs, the Motivation to identify and fulfill the needs of others, ranks 8th out of 32 Motivations across all leaders, with a mean of 7.91. Nearly 60% score Meet Needs at 8 or above, and more than one-third score it at 9 or above.
Service orientation is alive and well in corporate leadership, and the statistical story beneath the surface is extraordinary. Meet Needs has effectively zero correlation with every single achievement-oriented motivation in the dataset:
These aren’t just low correlations; they’re absent correlations. Statistically, knowing that a leader is highly motivated to serve the needs of others tells you absolutely nothing about whether they’re also motivated to achieve, overcome, or excel. And vice versa.
This means the corporate leadership population is running on dual fuel. Service and achievement aren’t on a spectrum; they function as independent engines. Rather than trade one for the other, leaders carry both.
Where Meet Needs does connect is with the relational Motivations:
- Collaborate — r=0.55
- Make the Team — r=0.44
- Persuade — r=0.44
This tells us that the leaders who are most wired to serve also tend to be the ones who build strong teams and influence through connection rather than authority. For anyone designing leadership development programs, this is a critical insight. You don’t develop service orientation by teaching empathy as a skill. For these leaders, it’s a core Motivation — and it operates independently of their drive to achieve. Honor and feed both, but don’t assume one produces the other.
The Take Charge paradox
Ask a hundred people what motivates corporate leaders, and most of them will put “taking charge” near the top of the list, but this data says otherwise. Take Charge ranks 27th out of 32 Motivations.
- Its average score is 6.71.
- Nearly one in five leaders — 19.3% — scores below a 5.
- Only 26 leaders out of 467 — barely 5.6% — have it in their top five Motivations at all.
- Fewer than 6% of corporate leaders are primarily motivated by being in charge.
This doesn’t mean these leaders can’t take charge. It means taking charge isn’t what drives them. There’s a profound difference between capacity and motivation. The leader who scores a 5 on Take Charge can still run a meeting, make tough calls, and direct a team. They just don’t wake up in the morning fueled by the desire to do it.
When Take Charge is high, scoring above 8, which is true for about 32% of leaders, the Motivations that rise alongside it are telling.
- Systematize jumps nearly a full point above average.
- Architect rises by a point.
- Gain Ownership goes up by nearly a point.
These aren’t power-hungry commanders. They’re builders: People whose desire to take charge is specifically in service of creating order, building systems, and owning outcomes. So when you encounter a leader who does run hot on Take Charge, understand the flavor. It’s not domination. It’s stewardship.
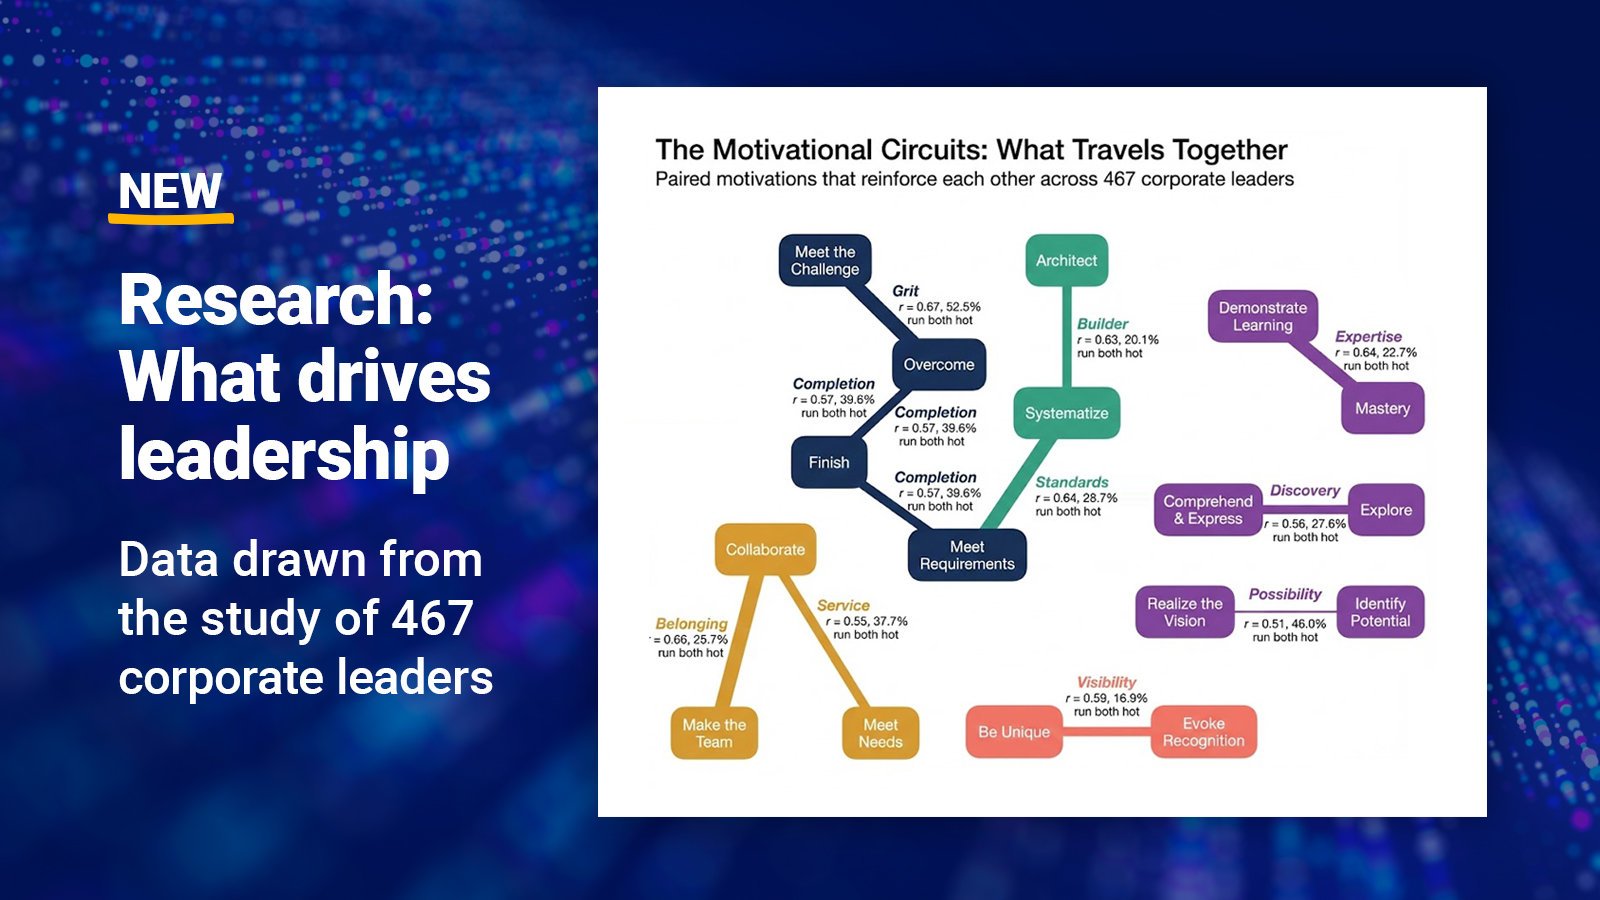
The motivational circuits: What travels together
One of the most useful findings in the data isn’t about individual Motivations at all. It’s about how Motivations pair up. Across 467 leaders, certain motivations move together so consistently that they function as circuits — paired engines that reinforce each other.
Here are the strongest:
- The Grit Circuit: Meet the Challenge + Overcome (r=0.67): Over half of all leaders score 8+ on both. This is the resilience core — the drive to face hard things combined with the determination to push through them.
- The Belonging Circuit: Collaborate + Make the Team (r=0.66): About a quarter of leaders (25.7%) score 8+ on both. These are leaders who are energized by shared effort and inclusion. For them, the team isn’t a tool; it’s the whole point.
- The Standards Circuit: Do It Right + Meet Requirements (r=0.64): Nearly 29% score 8+ on both. These are leaders whose internal compass points toward quality and expectation-fulfillment. They don’t just want things done. They want them done correctly.
- The Expertise Circuit: Demonstrate Learning + Mastery (r=0.64): About 23% score 8+ on both. These are the leaders who never stop learning and are driven to prove that learning through performance. When they master something, they need to show it.
- The Builder Circuit: Architect + Systematize (r=0.63): About 20% score 8+ on both. These leaders are wired to design structures and put systems in place. They’re not fixing things — they’re building them from the ground up.
- The Discovery Circuit: Comprehend & Express + Explore (r=0.56): Over 27% score 8+ on both. These leaders push beyond the limits of what they know, and they’re driven to articulate what they find. They’re the ones who come back from a deep investigation and can’t wait to share what they’ve learned.
- The Possibility Circuit: Realize the Vision + Identify Potential (r=0.51): Nearly 46% score 8+ on both. This is the largest “both high” population of any circuit, which makes sense as leaders who see the vision also tend to spot the untapped possibility that will get them there.
These circuits matter for organizational design.
A leader running the Grit Circuit needs challenges — without them, they plateau. A leader running the Builder Circuit needs greenfield opportunities — not cleanup assignments. Matching leaders to work that activates their circuits is one of the highest-leverage moves an organization can make.
The middle band: Where differentiation lives
Below the top five and above the bottom tier sits a band of Motivations where individual leaders start to diverge from each other. This is where leadership flavor emerges — the difference between two leaders who both score high on Finish and Meet The Challenge, but who go about their work in very different ways.
- Overcome (mean 7.99, rank #6): Already discussed as half of the Grit Circuit, Overcome is near-universal but not quite signature-level. The 58.5% who score 8+ tend to be the leaders who actively seek out what’s hard. Without difficulty, they’re restless.
- Explore (mean 7.92, rank #7): This is the curiosity Motivation, and it’s higher than most people would expect for corporate leaders. Over 57% score 8 or above. These leaders need to push beyond the known, and they pair strongly with Comprehend And Express (r=0.56), meaning they’re not exploring randomly. They’re exploring with the intent to understand and communicate what they find.
- Maximize (mean 7.90, rank #9): This is the Motivation to get the most out of something or someone. With one of the lowest variances in the dataset (std = 1.44), it’s almost as universal as the top five Motivations. Leaders don’t just want things done — they want things done at their highest possible level.
- Improve (mean 7.86, rank #10): This Motivation focuses on continuous improvement. Fifty-seven percent of leaders score 8 or above. It correlates with Advance (r=0.40) and Identify Potential (r=0.39), suggesting a cluster of leaders who are always scanning for what could be better and how to get there.
- Develop (mean 7.83, rank #11): This is the drive to build from start to finish. It correlates with both Finish (r=0.38) and Realize The Vision (r=0.33), placing it at the intersection of completion and creation. These are leaders who don’t just want to cross the finish line — they want to have built the thing they’re finishing.
- Identify Potential (mean 7.73, rank #12): This is the talent-spotter motivation. Over half of leaders score 8 or above, and its strong pairing with Realize The Vision (r=0.51) makes it one of the most strategically relevant Motivations in the middle band. These are leaders who see untapped value in people, markets, and assets, and are driven to unlock it.
- Excel (mean 7.67, rank #13): This Motivation correlates most strongly with Mastery (r=0.61) and Demonstrate Learning (r=0.57), suggesting that the drive to excel is more about personal performance standards than competitive dominance.
- Demonstrate Learning (mean 7.64, rank #14): Seventy-three percent of leaders score 7 or above on the Motivation to learn something new and show they can do it. This is where leadership development programs find their natural audience — but only if the learning leads to application. These leaders don’t want to learn in theory. They need to demonstrate.
What the middle band tells us is that the leadership signature gives every leader the same floor, and the middle band gives them their fingerprint. Two leaders can both be wired to Finish and Meet The Challenge, but diverge completely in how they get there — one through exploration and discovery, and the other through standards and systems.
The Collaborate question: Leadership’s most polarized Motivation
Most Motivations follow a roughly normal distribution: A bell curve with most leaders clustered in the middle. Collaborate is different. With a mean of 7.41 and a standard deviation of 2.00, Collaborate is the most polarized motivation in the leadership population. Nearly 13% of leaders score below 5, while 24% score 9 or above.
Leaders either lean hard into collaboration or they pull back from it. There’s less middle ground for Collaborate than for any other motivational pattern. This makes practical sense as collaboration requires a fundamentally relational posture toward work. You either find deep energy in shared effort or you find your energy elsewhere. Few leaders are neutral on the question.
Collaborate pairs strongly with Make The Team (r=0.66) and Meet Needs (r=0.55), forming what we might call the Relational Engine — a set of Motivations that, when running together, produce leaders who build strong, cohesive teams and are deeply attuned to the people around them. When these Motivations are all low, you get a leader who operates as a high-functioning individual contributor in a leadership seat — effective, but potentially disconnected from the relational fabric of their organization.
The bottom of the list: What leaders are not motivated by
What sits at the bottom of the ranking is just as revealing as what sits at the top. These are the Motivations that corporate leaders, as a group, consistently score lowest on:
- Be Unique — dead last at 6.32 — is the Motivation to display a talent or quality that is extraordinary and different from others. Corporate leaders, overwhelmingly, are not driven by being distinctive. They’re driven by being effective. Be Unique also has the highest variance of any motivation (std = 2.22), meaning it divides leaders more than any other dynamic: 28% score below 5, while 26% score above 8. It’s not that leaders can’t be unique. It’s that for most of them, uniqueness isn’t the point.
- Design, the motivation to take a vision and give it form through creative design, sits nearly as low, with a quarter of leaders scoring below 5, and 62 leaders rating it their single lowest Motivation. In a population wired to finish, realize, and impact, the aesthetic and creative impulse is relatively subdued.
- Evoke Recognition, the desire to capture attention, lands at #30. Combined with the Quiet Achiever finding, this paints a consistent picture: The average corporate leader doesn’t want the spotlight. A full 25% score it below 5, and 43 leaders rank it dead last.
- Mastery, the drive to have complete command of a skill or subject, ranks #29. Only one leader in the entire study has Mastery as their number-one Motivation. Leaders are generalists, not specialists. They need to know enough to make decisions, not enough to be the foremost expert. This has direct implications for how organizations develop their senior leaders: Depth of expertise isn’t what drives them. Breadth of impact is.
The vulnerability in plain sight
The bottom-of-the-list motivations represent a structural vulnerability in corporate leadership. When leaders systematically undervalue distinctiveness (Be Unique), creative expression (Design), and deep expertise (Mastery), organizations risk building a leadership culture that is excellent at execution but vulnerable to disruption.
The Motivations that drive differentiation, creative problem-solving, and deep technical understanding are precisely the ones that corporate leaders, on average, aren’t wired for.
This isn’t a flaw in individual leaders. It’s a pattern in the population. It suggests that the most effective leadership teams aren’t built by finding more people who match the leadership signature, but by finding people who complement it. Surrounding high-Finish, high-challenge leaders with people who are driven by Design, Be Unique, and Mastery creates a team that can both execute and innovate.
The profile shape: How wide is a leader’s motivational range?
One of the questions the data lets us answer is: How broad are corporate leaders in their motivational profile? Are they narrow specialists, driven by a few things intensely, or are they activated across a wide range?
The answer is remarkably broad:
- The average leader scores higher than 8 on 14.2 of 32 Motivations. That’s nearly half of all respondents.
- About 91% of leaders score higher than 8 on at least 5 Motivations.
- Two-thirds score higher than 8 on 10 or more Motivations.
- Toughly a quarter (24%) score higher than 8 on 20 or more Motivations.
What’s really interesting is that at the same time, the average leader scores lower than 5 on only 3.8 Motivations, and a full one-third of leaders have zero Motivations scoring below 5.
This is the motivational profile of a generalist: Someone who is activated by many things, rarely turned off by anything, and capable of drawing energy from a wide range of situations. It helps explain why corporate leaders tend to be adaptable. They don’t depend on a narrow set of conditions to be motivated — they find fuel almost everywhere.
But breadth isn’t without its risks.
A leader who is motivated by everything may struggle to prioritize. They may say yes too often, invest energy in too many directions, or have difficulty distinguishing between what they’re motivated to do and what they’re best positioned to do. The leaders who stand out aren’t necessarily the ones with the broadest profiles. They’re the leaders who know which of their Motivations to lean into for a given situation.
What this means for you
If you’re a corporate leader reading this, several things are probably true about you:
- You are driven to finish things. Completion is a core part of how you experience satisfaction, not a preference. Unfinished projects don’t just bother you; they diminish your sense of purpose.
- You seek out challenges, and you need them. Without meaningful difficulty in your work, you’re not just bored; you’re motivationally starved.
- You want to make things real. Ideas without execution feel hollow. You are drawn to the bridge between concept and reality.
- You want to matter. Not in an ego-driven way, you simply want your work to have a genuine impact on the world around you.
- You want to be central to that impact. Not necessarily in the spotlight, but at the hub. You want to be the person without whom things wouldn’t come together.
Underneath all of that, you probably also carry a deep orientation toward serving the needs of others — one that has nothing to do with your achievement drive and everything to do with who you are as a person.
These Motivations are not skills, competencies, or behaviors you were taught in an MBA program. They are the engines that have been running beneath your career from the very beginning. Understanding them doesn’t change who you are. It gives you language for what’s been true all along.
For organizations: Five implications
1. Stop screening for charisma
Our data proves that the Motivations most commonly associated with “leadership presence” — Take Charge, Evoke Recognition, and Persuade — are among the lowest in the actual leadership population. If your leadership pipeline is biased toward visible, commanding personalities, you are systematically filtering out the people who are most motivated to lead.
2. Design for the dual-fuel engine
Your best leaders are running on both achievement and service simultaneously, and these engines are independent. Development programs that focus exclusively on results will leave the service engine unfed. Programs that focus exclusively on empathy and emotional intelligence will leave the achievement engine unfed. Do both.
3. Match leaders to their circuits
The motivational circuits — Grit, Builder, Standards, Discovery, and the rest — tell you what kind of work will energize a given leader. A leader running the Grit Circuit needs the hard turnaround, not the steady-state operation. A leader running the Builder Circuit needs the greenfield project, not the optimization assignment. Mismatches reduce performance and erode motivation over time.
4. Complement the signature, don’t replicate it
The leadership signature is strong on execution and impact but structurally weak on differentiation, creative design, and deep expertise. The most effective leadership teams fill these gaps intentionally. If everyone on the senior team is wired to Finish and Meet The Challenge but nobody is wired to Design or Be Unique, the team will execute brilliantly on yesterday’s strategy.
5. Recognize that breadth is both a strength and a risk
Leaders who are motivated by nearly everything are versatile, but they need help focusing. The highest-leverage coaching conversation you can have with a broadly motivated leader isn’t “what are you good at?” It’s “which of your Motivations should you lean into right now, given what the organization needs?”
About this study
This analysis is based on Motivation Code (MCode) assessments administered to 467 corporate leaders. MCode measures 32 distinct motivational dynamics — enduring patterns of motivation that reflect what energizes and drives a person at a fundamental level. These Motivations are not personality traits, behavioral styles, or skill assessments. They represent the underlying why behind how a person engages with their work and their world.
The 32 Motivations assessed are: Advance, Architect, Be Key, Be Unique, Collaborate, Comprehend & Express, Demonstrate Learning, Design, Develop, Do It Right, Establish, Evoke Recognition, Excel, Experience the Ideal, Explore, Finish, Gain Ownership, Identify Potential, Improve, Make an Impact, Make It Work, Make the Team, Mastery, Maximize, Meet Needs, Meet Requirements, Meet the Challenge, Overcome, Persuade, Realize the Vision, Systematize, and Take Charge.
MCode is built on more than 60 years of SIMA (System for Identifying Motivated Abilities) research into human motivation. Ready to discover your MCode and see your own motivational scores? Get started by taking the assessment yourself.